Data Interpretation - Bar Charts - Discussion
Discussion Forum : Bar Charts - Bar Chart 10 (Q.No. 4)
Directions to Solve
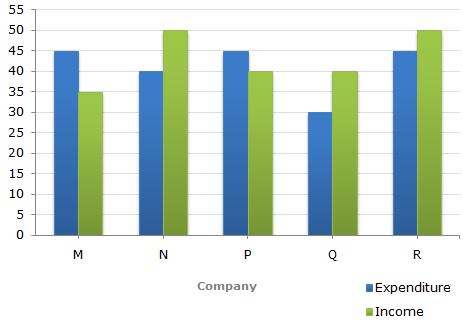
The following bar graph shows the Income and Expenditures (in million US $) of five companies in the year 2001. The percent profit or loss of a company is given by
| % Profit/Loss = | Income - Expenditure | x 100 |
| Expenditure |
Income and Expenditure (in million US $) of five companies in the year 2001.
4.
For Company R, if the expenditure had increased by 20% in year 2001 from year 2000 and the company had earned profit of 10% in 2000, what was the Company's income in 2000 (in million US $)?
Answer: Option
Explanation:
Let the expenditure of Company R in 2000 be x million US $.
| Then, expenditure of Company R in 2001 = |  |
120 | x x |  |
million US $. |
| 100 |
 |
120x | = 45  x = 37.5. x = 37.5. |
| 100 |
i.e., expenditure of Company R in 2000 = 37.5 million US $.
Let the income of Company R in 2000 be I million US $.
| Then, 10 = | (I - 37.5) | x 100 | [  %Profit in 2000 = 10%] %Profit in 2000 = 10%] |
| 37.5 |
I - 37.5 = 3.75
I = 41.25
i.e., Income of Company R in 2000 = 41.25 million US $.
Discussion:
13 comments Page 2 of 2.
Manisha said:
1 decade ago
In question profit is given 20% but in the solution why we solved with 120(2nd step)?
Soundarya said:
1 decade ago
step 1: 10 = [(I-37.5)/ 37.5]* 100.
step 2: 37.5*10 = (I-37.5)100.
step 3: 375/100 = (I-37.5).
step 4: 3.75 = I-37.5.
step 5: 3.75+37.5 = I.
step 6: 41.25 = I.
step 2: 37.5*10 = (I-37.5)100.
step 3: 375/100 = (I-37.5).
step 4: 3.75 = I-37.5.
step 5: 3.75+37.5 = I.
step 6: 41.25 = I.
ATIF said:
1 decade ago
I want to know know that by you have assume this (I million) and in the last 2nd step how this answer came I=41.25.
Post your comments here:
Quick links
Quantitative Aptitude
Verbal (English)
Reasoning
Programming
Interview
Placement Papers