Data Interpretation - Bar Charts - Discussion
Discussion Forum : Bar Charts - Bar Chart 5 (Q.No. 5)
Directions to Solve
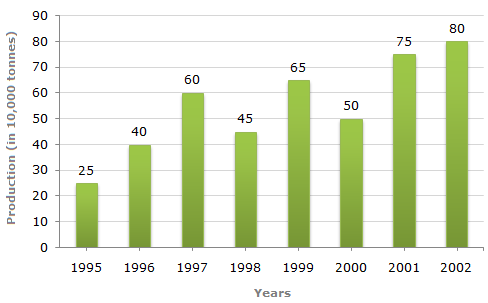
Study the bar chart and answer the question based on it.
Production of Fertilizers by a Company (in 1000 tonnes) Over the Years
5.
In how many of the given years was the production of fertilizers more than the average production of the given years?
Answer: Option
Explanation:
Average production (in 10000 tonnes) over the given years
| = | 1 | (25 + 40 + 60 + 45 + 65 + 50 + 75 + 80) = 55. |
| 8 |
 The productions during the years 1997, 1999, 2001 and 2002 are more than the average production.
Discussion:
4 comments Page 1 of 1.
Sparsh Chandra said:
1 decade ago
Its written average production of the given years. Never ever written average production directly it should follow year by year average production. So answer should be 3.
(1)
Ani said:
8 years ago
1/8 (25+40+60+45+65+50+75+80) = 60.
So, 3 is the answer.
So, 3 is the answer.
(1)
Sreeth said:
7 years ago
Why 1/8? Please explain.
(1)
Muskan said:
7 years ago
1/8 because there is 8 years given.
(1)
Post your comments here:
Quick links
Quantitative Aptitude
Verbal (English)
Reasoning
Programming
Interview
Placement Papers