Data Interpretation - Bar Charts - Discussion
Discussion Forum : Bar Charts - Bar Chart 15 (Q.No. 2)
Directions to Solve
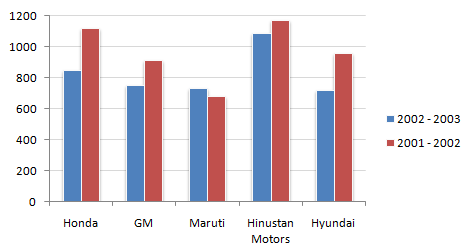
Study the following bar chart and answer the questions carefully.
Sales Turnover of 5 Companies (in Rs. crores)
2.
What is the absolute change in overall sales turnover of the five companies together between 2001 - 2002 and 2002 - 2003 ?
Answer: Option
Explanation:
Absolute value of the difference between the sum of the turnover of the five companies for 2001 - 2002 and 2002 - 2003.
Discussion:
16 comments Page 2 of 2.
Joseph said:
6 years ago
Yes, Option D is valid. We just estimated some values because the graph is not to giving distinct values.
(2)
Subash said:
5 years ago
Why option D is incorrect? Pease explain clearly.
Vishal Jain said:
5 years ago
@All.
It's Data InAdequate ,datas are like for 2002-2003 -847.78,750.31,681.98,1171.01,962.58 And for 2001-2002 are 1122.66,913.63,681.98,1171.01,962.58 now the answer is 142.48.
It's Data InAdequate ,datas are like for 2002-2003 -847.78,750.31,681.98,1171.01,962.58 And for 2001-2002 are 1122.66,913.63,681.98,1171.01,962.58 now the answer is 142.48.
(2)
Vishal Jain said:
5 years ago
I think the right answer is 142.42.
Mamta said:
4 years ago
@Vishal.
From where did you drive all these values? Please explain your answer.
From where did you drive all these values? Please explain your answer.
Paridhi khandelwal said:
2 years ago
I think the right answer is 600 which can be approximated as 683. So, the correct option is C.
(1)
Post your comments here:
Quick links
Quantitative Aptitude
Verbal (English)
Reasoning
Programming
Interview
Placement Papers