Data Interpretation - Bar Charts - Discussion
Discussion Forum : Bar Charts - Bar Chart 3 (Q.No. 2)
Directions to Solve
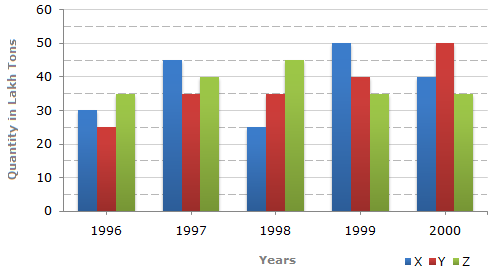
The bar graph given below shows the data of the production of paper (in lakh tonnes) by three different companies X, Y and Z over the years.
Production of Paper (in lakh tonnes) by Three Companies X, Y and Z over the Years.
2.
What is the ratio of the average production of Company X in the period 1998-2000 to the average production of Company Y in the same period?
Answer: Option
Explanation:
Average production of Company X in the period 1998-2000
| = |  |
1 | x (25 + 50 + 40) | ![]](/_files/images/data-interpretation/common/15-sym-cbracket-h1.gif) |
= |  |
115 |  |
lakh tons. |
| 3 | 3 |
Average production of Company Y in the period 1998-2000
| = | |
1 | x (35 + 40 + 50) | |
= | |
125 | |
lakh tons. |
| 3 | 3 |
 Required ratio = Required ratio = |
|
= | 115 | = | 23 | . | ||||
|
125 | 25 |
Discussion:
5 comments Page 1 of 1.
Aadarsh kshirsagar said:
3 weeks ago
X = 25 + 50 + 40 = 115.
Y = 35 + 40 +50 = 125.
~ 115/125.
115/5 = 23.
125/5 = 25.
And the answer is 23:25.
Y = 35 + 40 +50 = 125.
~ 115/125.
115/5 = 23.
125/5 = 25.
And the answer is 23:25.
Divya said:
4 years ago
@Kamalpreet Kaur.
That's the cancellation with 5 table 5*23=115 and 5*25=125.
That's the cancellation with 5 table 5*23=115 and 5*25=125.
(1)
Kamalpreet kaur said:
9 years ago
How this answer 23/25? because after average the answer is different.
SANDEEP said:
10 years ago
Can anyone explain the step (115/3)/(125/3) = 23/25?
Maria said:
1 decade ago
Why did they not calculate the average for fraction part?
(115/3) / (125/3).
(115/3) / (125/3).
(1)
Post your comments here:
Quick links
Quantitative Aptitude
Verbal (English)
Reasoning
Programming
Interview
Placement Papers