Data Interpretation - Bar Charts - Discussion
Discussion Forum : Bar Charts - Bar Chart 15 (Q.No. 4)
Directions to Solve
Study the following bar chart and answer the questions carefully.
Sales Turnover of 5 Companies (in Rs. crores)
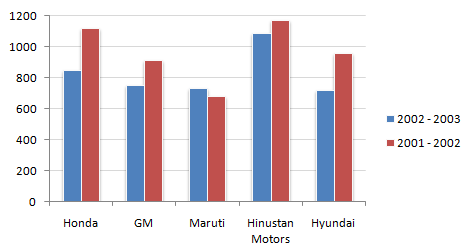
4.
What should have been the sales turnover of GM in 2002 - 2003 to have shown an excess of the same quantum over 2001 - 2002 as shown by the sales turnover of Maruti ?
Answer: Option
Explanation:
GM should have increased its sales turnover by Rs.49.13 crore. Hence, the answer is 913.63 + 49.13 = 962.76.
Discussion:
15 comments Page 2 of 2.
Deepak said:
1 decade ago
Can any body explain this question more clearly?
Garima said:
1 decade ago
Exactly just the difference 1 pt. In this vague graph plus the explanation is also not clear.
Devansh said:
1 decade ago
I didn't get the above question so kindly explain from where we get the value 913.63.
Chetan said:
1 decade ago
Seriously? How did you get such decimal number accuracy through that graph? Please don't scare us that answer expected from us will also be expected to such accuracy. And I am perplexed as to how you derived to the solution.
Shay said:
1 decade ago
Can someone please explain how you can get to an accuracy of one digit when the grpah is so vague?
How was 49.13 calculated? And how was 913.63?
How was 49.13 calculated? And how was 913.63?
Post your comments here:
Quick links
Quantitative Aptitude
Verbal (English)
Reasoning
Programming
Interview
Placement Papers