Electronics and Communication Engineering - Automatic Control Systems - Discussion
Discussion Forum : Automatic Control Systems - Section 8 (Q.No. 43)
43.
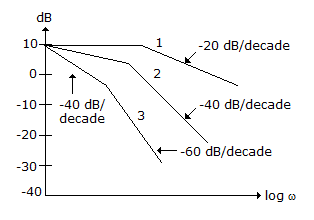
The given figure shows dB magnitude plots for type 0, type 1 and type 2 systems. Out of these
Discussion:
Be the first person to comment on this question !
Post your comments here:
Quick links
Quantitative Aptitude
Verbal (English)
Reasoning
Programming
Interview
Placement Papers