Electronics and Communication Engineering - Automatic Control Systems - Discussion
Discussion Forum : Automatic Control Systems - Section 4 (Q.No. 36)
36.
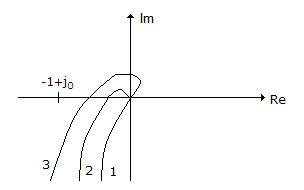
The given figure shows three Nyquist plots of G(s) H(s) = e-sT/[s(s + 1)] for different values of T. The curves 1, 2, 3 can be
Discussion:
Be the first person to comment on this question !
Post your comments here:
Quick links
Quantitative Aptitude
Verbal (English)
Reasoning
Programming
Interview
Placement Papers