Data Interpretation - Pie Charts - Discussion
Discussion Forum : Pie Charts - Pie Chart 10 (Q.No. 4)
Directions to Solve
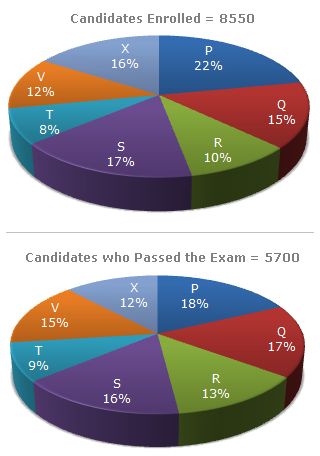
Study the following graph carefully and answer the questions given below:
Distribution of candidates who were enrolled for MBA entrance exam and the candidates (out of those enrolled) who passed the exam in different institutes:
4.
What is the percentage of candidates passed to the candidates enrolled for institutes Q and R together?
Answer: Option
Explanation:
| Candidates passed from institutes Q and R together | = [(13% + 17%) of 5700] |
| = 30% of 5700. | |
| Candidates enrolled from institutes Q and R together | = [(15% + 10%) of 8550] |
| = 25% of 8550. |
 Required Percentage Required Percentage |
|
|||||||
|
||||||||
| = 80%. |


Discussion:
6 comments Page 1 of 1.
Tryhard said:
8 years ago
In the top chart, 10%+115% = 25%, but 25% of 8550 isn't a whole number, and you can't have half a candidate.
(1)
HARSH PARIDAR said:
5 years ago
30% of 5700 is 1710.
25% of 8550 is 2137.5.
25% of 8550 is 2137.5.
(1)
RAJNIKANTH G said:
1 decade ago
The figure should be 30 % of 5700 instead of 30 % of 57000 in the second line of the explanation. Please amend the same.
Arul said:
1 decade ago
Any shortcuts for 1710/2137?
Jani said:
7 years ago
Please explain to me.
Anil Kambale said:
4 years ago
Please explain in detail.
Post your comments here:
Quick links
Quantitative Aptitude
Verbal (English)
Reasoning
Programming
Interview
Placement Papers