Data Interpretation - Pie Charts - Discussion
Discussion Forum : Pie Charts - Pie Chart 4 (Q.No. 3)
Directions to Solve
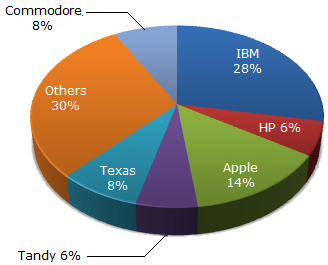
The pie chart shows the distribution of New York market share by value of different computer companies in 2005.

The pie chart shows the distribution of New York market share by volume of different computer companies in 2005.
Number of units sold in 2005 in New York = 1,500
Value of units sold in 2005 in New York = US $1,650,000.

3.
In 2005, the average unit sale price of an IBM PC was approximately (in US$)
Answer: Option
Explanation:
IBM accounts for 28% of the share by value and 10% of the share by volume.
28% of 1650000 = 28 x 1650000/100 = 462000
10% of 1500 = 10 x 1500/100 = 150
Therefore, average unit sale price = 462000/150 = 3080.
Discussion:
6 comments Page 1 of 1.
Paul said:
7 years ago
It should be 393.
(1)
NIRANJAN said:
7 years ago
Calculation is right. Because only part of IBM Pc which in VALUE and VOLUME ($ per unit) for calculating of average of IBM PC.
(1)
Anil kumar said:
4 years ago
Here, given solution is a Right calculation because the above pie chart is the distribution of value and the below chart is the volume share distribution.
(1)
Sandeep wasnik said:
9 years ago
Someone please explain in detail.
Gnaneswari said:
7 years ago
Can you explain in detail?
Harsh said:
10 months ago
Let the value of apple = 50,
Volume(no of apple) =5,
Unit sale(1 apple sale) = 50/5=10.
Volume(no of apple) =5,
Unit sale(1 apple sale) = 50/5=10.
Post your comments here:
Quick links
Quantitative Aptitude
Verbal (English)
Reasoning
Programming
Interview
Placement Papers