Data Interpretation - Bar Charts - Discussion
Discussion Forum : Bar Charts - Bar Chart 12 (Q.No. 4)
Directions to Solve
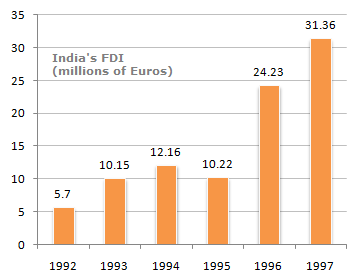
The following bar chart shows the trends of foreign direct investments(FDI) into India from all over the world.
Trends of FDI in India
4.
Which year exhibited the highest growth in FDI in India over the period shown ?
Answer: Option
Explanation:
It can be seen that the FDI in 1996 more than doubles over that of 1995. No other year is close to that rate of growth.
Discussion:
1 comments Page 1 of 1.
John said:
1 decade ago
How can we know if they are talking percentage or absolute? As a percentage FDI grew most from 92 - 93.
Post your comments here:
Quick links
Quantitative Aptitude
Verbal (English)
Reasoning
Programming
Interview
Placement Papers