Data Interpretation - Bar Charts - Discussion
Discussion Forum : Bar Charts - Bar Chart 12 (Q.No. 5)
Directions to Solve
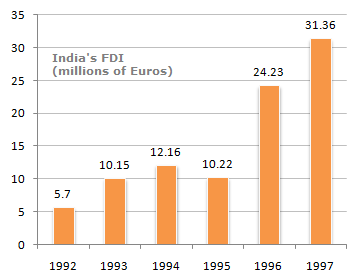
The following bar chart shows the trends of foreign direct investments(FDI) into India from all over the world.
Trends of FDI in India
5.
What was India's total FDI for the period shown in the figure ?
Answer: Option
Explanation:
Total FDI investment in the figure shown is = 5.7 + 10.15 + 12.16 + 10.22 + 24.23 + 31.36 = 93.82 billion.
Discussion:
6 comments Page 1 of 1.
Joanah Angela Ngking said:
3 years ago
Compute it from 31.36 + 24.23 + 10.22 + 12.16 + 10.15 + 5.7 = 93.82.
(1)
Sri said:
8 years ago
Yeah, it is the correct answer place it as 5.70. Agree @Ron.
(2)
Ron said:
1 decade ago
@Imran.
In year 1992, 5.7--> add this as 5.70.
In year 1992, 5.7--> add this as 5.70.
Imran said:
1 decade ago
If I calculate the total manually I get 93.19 but when calculated with calculator I get 93.82?
(1)
Ashu said:
1 decade ago
its wrong ans write is 93.79
Sanjay said:
1 decade ago
As neither any option nor question carries unit billion, so I thought it should be D i.e. none of these. Please explain why answer is A. ?
Post your comments here:
Quick links
Quantitative Aptitude
Verbal (English)
Reasoning
Programming
Interview
Placement Papers