Data Interpretation - Bar Charts - Discussion
Discussion Forum : Bar Charts - Bar Chart 19 (Q.No. 4)
Directions to Solve
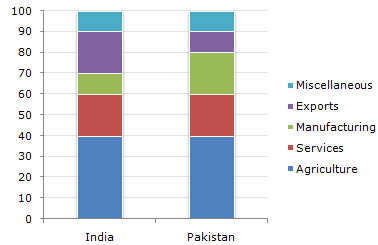
The following bar chart shows the composition of the GDP two countries (India and Pakistan).
Composition of GDP of Two Countries
4.
Which country accounts for higher earning out of Services and Miscellaneous together ?
Answer: Option
Explanation:
Although the percentage on Services and Miscellaneous put together is equal for both the countries, we cannot comment on this since we have no data about the respective GDP's.
Discussion:
6 comments Page 1 of 1.
Kanishka Roy said:
6 years ago
Actually, in one of the questions, we assume the GDP of Pakistan as given in the previous question so we can, on the one hand, assume those values for this question. However, there are two different values to be assumed in previous questions for India. In conclusion, it is best to solve this question as an individual question and assume the GDP to be a non-existent parameter. Hence the answer should be D.
(2)
Janhvi said:
8 years ago
I think the answer should be C.
(2)
Anirudh Menon said:
9 years ago
@Lokesh.
The GDPs of both countries were provided in questions asked*.
It is Provided in the previous question.
The amount of GDP is not mentioned in the bar diagram hence we can't interpret it to be 10000 and 30000 which is given in the previous question. We have to refer the diagram and answer the question, not the information is given in the previous question to answer any question.
(1)
Lokesh pawar said:
9 years ago
The GDPs of both countries were provided in questions asked. India was said to be 30000 and Pakistan was said to be 10000. So it can determine that India produced more earnings for services and misc (600) compare to Pakistan's (only 300).
Rishabh khetan said:
1 decade ago
Actually the values of India and pakistan given in the previous questions were just an example. So we cannot say that those values are actual ones. So why can't the answer for this question be D? since no values are given and so that we can expect it as equal.
Ebenezer Makinde said:
2 decades ago
The GDPs of both countries were provided in questions asked. India was said to be 30000 and Pakistan was said to be 10000. So it can determined that India produced more earnings for services and misc.(600) compare to Pakistan's(only 300)
Post your comments here:
Quick links
Quantitative Aptitude
Verbal (English)
Reasoning
Programming
Interview
Placement Papers