Data Interpretation - Bar Charts - Discussion
Discussion Forum : Bar Charts - Bar Chart 19 (Q.No. 1)
Directions to Solve
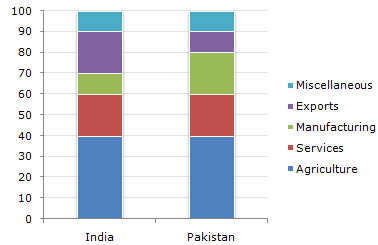
The following bar chart shows the composition of the GDP two countries (India and Pakistan).
Composition of GDP of Two Countries
1.
If the total GDP of Pakistan is Rs. 10,000 crore, then a GDP accounted for by Manufacturing is ?
Answer: Option
Explanation:
20% of 10000 = 2000
Discussion:
4 comments Page 1 of 1.
Sowmya said:
6 years ago
(20/100) * 100000.
Nikita said:
7 years ago
How to solve 20% of 100000?
Please tell me.
Please tell me.
Dinesh said:
10 years ago
Yes, it's correct because the green wich indicates manufacturing and it is 60 - 80 and its difference is 20%. So 20%of 100000 = 2000.
(1)
Naga lakshmi said:
10 years ago
How come exactly 20% of manufacturing?
Can anybody explain?
Can anybody explain?
Post your comments here:
Quick links
Quantitative Aptitude
Verbal (English)
Reasoning
Programming
Interview
Placement Papers