Data Interpretation - Bar Charts - Discussion
Discussion Forum : Bar Charts - Bar Chart 16 (Q.No. 1)
Directions to Solve
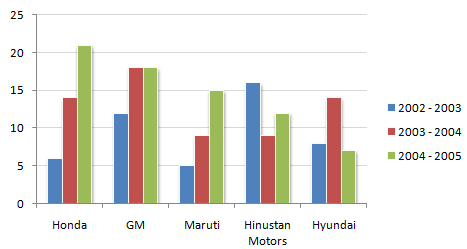
The following chart shows the production of cars in thousands.
Production of Cars for 2002 - 2005 period from the Selected Manufacturers
1.
How many companies have shown production below their average production in 2002 - 2003, but have showed above the average production in 2003 - 2004 ?
Answer: Option
Explanation:
Average sales of company:
Honda = (6 + 14 + 21)/3 = 13.66
GM = (12 + 18 + 18)/3 = 16
Maruti = (5 + 9 + 15)/3 = 9.66
Hindustan Motors= (16 + 9 + 12)/3 = 12.33
Hyundai = (8 + 14 + 7)/3 = 9.66
Discussion:
9 comments Page 1 of 1.
Kiran said:
5 years ago
Given is average of each company.
To get average of entire company:
(13.66 + 16 + 9.66 + 12.33 + 9.66)/5 = 12.26.
To get average of entire company:
(13.66 + 16 + 9.66 + 12.33 + 9.66)/5 = 12.26.
(1)
Priya said:
5 years ago
Very helpful, Thank you @Deepu.
(4)
Deepu said:
6 years ago
The answer is C. Lets see the explanation:
First, find the average production in 2002-3 is 9.4, then find average production in 2003-4 is 12.8
Companies Below Above
Honda 6 14
GM No value 12,18
Martuhi 5,9 No value
HM 9 16
Hyundai 8 14
In question, they asked below average production in 2002 - 2003 (9.4) and above average production in 2003 - 2004(12.8). From the table, we have to select the company which is having both below and above values. They are Honda, HM, Hyundai.
(7)
Nix said:
6 years ago
The question is to find which companies show values below their average value in 2002-2003 and above their average value in 2003-2004.
First, find average values of all companies and check with 2002-2003 and 2003-2004.
Honda= (6+14+21) /3=13.66, in 2002-2003 value is 6 which is below of average value, but in 2003-2004 value is high.
First, find average values of all companies and check with 2002-2003 and 2003-2004.
Honda= (6+14+21) /3=13.66, in 2002-2003 value is 6 which is below of average value, but in 2003-2004 value is high.
Choqi said:
8 years ago
Honda(2003-04)=14 is above Avg = 13.66.
GM(2003-04)=18 is above Avg = 16.
Hyundai(2003-04)=14 is above Avg = 9.66.
So, Honda + GM + Hyundai = 3.
GM(2003-04)=18 is above Avg = 16.
Hyundai(2003-04)=14 is above Avg = 9.66.
So, Honda + GM + Hyundai = 3.
Akash said:
10 years ago
In 2002-03 = Avg is 9.4
In 2003-04 = Avg is 12.6
Then honda Maruti and Hyundai shows below avg and honda gm and Hyundai show above avg. So, the answer is 3 companies.
In 2003-04 = Avg is 12.6
Then honda Maruti and Hyundai shows below avg and honda gm and Hyundai show above avg. So, the answer is 3 companies.
Shikha said:
1 decade ago
Please explain this question in detail,
According to question I calculated the avg yearly wise.
In 2002-03 = Avg production is 11.2.
In 2003-4 = Avg production is 9.4.
Then How to do find out.
"How many companies have shown production below their average production in 2002-2003, but have showed above the average production in 2003-2004".
According to question I calculated the avg yearly wise.
In 2002-03 = Avg production is 11.2.
In 2003-4 = Avg production is 9.4.
Then How to do find out.
"How many companies have shown production below their average production in 2002-2003, but have showed above the average production in 2003-2004".
Ramakanth said:
1 decade ago
First find out the average of every company for the three years then compare that average with the company's 2002-03 and 2003-04 values.
(1)
Deepak said:
1 decade ago
Can any body explain this question more clearly?
Post your comments here:
Quick links
Quantitative Aptitude
Verbal (English)
Reasoning
Programming
Interview
Placement Papers