Data Interpretation - Bar Charts - Discussion
Discussion Forum : Bar Charts - Bar Chart 10 (Q.No. 2)
Directions to Solve
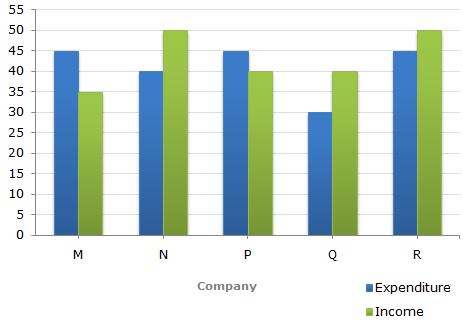
The following bar graph shows the Income and Expenditures (in million US $) of five companies in the year 2001. The percent profit or loss of a company is given by
| % Profit/Loss = | Income - Expenditure | x 100 |
| Expenditure |
Income and Expenditure (in million US $) of five companies in the year 2001.
2.
In 2001, what was the approximate percentage of profit/loss of all the five Companies taken together?
Answer: Option
Explanation:
Total income of all five companies
= (35 + 50 + 40 + 40 + 50) million US $
= 215 million US $.
Total expenditure of all five companies
= (45 + 40 + 45 + 30 + 45) million US $
= 205 million US $.
 % Profit = % Profit = |
 |
(215 - 205) | x 100 | ![]](/_files/images/data-interpretation/common/15-sym-cbracket-h1.gif) |
% = 4.88%  5%. 5%. |
| 205 |
Discussion:
2 comments Page 1 of 1.
Abhishek said:
4 years ago
How the income consider either profit or loss?
(3)
Harry said:
7 years ago
Total income = 205.
Total Expenditure= 215.
Please check the solution once.
Total Expenditure= 215.
Please check the solution once.
(3)
Post your comments here:
Quick links
Quantitative Aptitude
Verbal (English)
Reasoning
Programming
Interview
Placement Papers