Data Interpretation - Bar Charts - Discussion
Discussion Forum : Bar Charts - Bar Chart 8 (Q.No. 4)
Directions to Solve
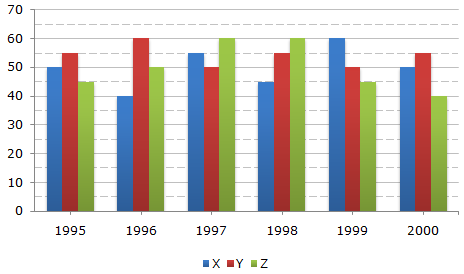
A soft drink company prepares drinks of three different flavours - X, Y and Z. The production of three flavours over a period of six years has been expressed in the bar graph provided below.
Production of Three Different Flavours X, Y and Z by a Company over the years (in lakh bottles)
4.
What was the approximate decline in the production of flavour Z in 2000 as compared to the production in 1998?
Answer: Option
Explanation:
Percentage decline in the production of flavour Z in 2000 as compared to the production in 1998
| = |  |
(60 - 40) | x 100 | ![]](/_files/images/data-interpretation/common/15-sym-cbracket-h1.gif) |
% |
| 60 |
| = |  |
20 | x 100 |  |
% |
| 60 |
= 33.33%
 33%.
33%.
Discussion:
6 comments Page 1 of 1.
Aastik kumar yadav said:
2 years ago
@All.
If there is a term like a percentage decrease, decline, less than the denominator value is always greater compared to the given two values.
Here in between 40 and 60 is greater so we use 60 value in the denominator.
If there is a term like a percentage increase, then the denominator value is always smaller one compared to the given two values.
(1)
Vidhyathny said:
2 years ago
Why divided by 60? Please explain.
(1)
Manav Pawar said:
4 years ago
Why divided by 60? Why not 40? Please explain me.
(2)
Poonam said:
5 years ago
No, In 2000 z is 40 because In 1999 z is 45 so the answer is correct.
(1)
Raj said:
6 years ago
I can't understand please can anyone explain it in breif?
Prathumna said:
7 years ago
In 2000 Z is 45 lakhs. So the answer will become (60~45/60)*100=25%. Right?
(1)
Post your comments here:
Quick links
Quantitative Aptitude
Verbal (English)
Reasoning
Programming
Interview
Placement Papers