Data Interpretation - Bar Charts - Discussion
Discussion Forum : Bar Charts - Bar Chart 16 (Q.No. 3)
Directions to Solve
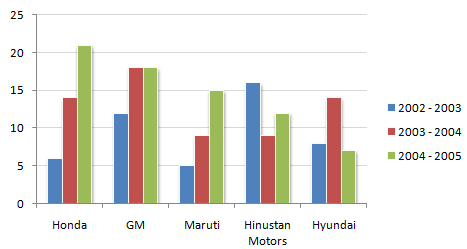
The following chart shows the production of cars in thousands.
Production of Cars for 2002 - 2005 period from the Selected Manufacturers
3.
For how many companies has there been no decrease in production in any year from the previous year ?
Answer: Option
Explanation:
By visual inspection we can say that Honda, GM and Maruti have not shown a decrease.
Discussion:
1 comments Page 1 of 1.
Kezang dawa said:
6 years ago
How come Honda, GM and Maruti can anyone explain? please.
(1)
Post your comments here:
Quick links
Quantitative Aptitude
Verbal (English)
Reasoning
Programming
Interview
Placement Papers