Data Interpretation - Bar Charts - Discussion
Discussion Forum : Bar Charts - Bar Chart 8 (Q.No. 3)
Directions to Solve
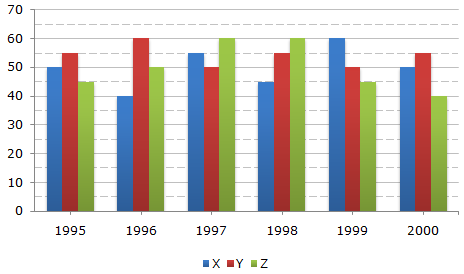
A soft drink company prepares drinks of three different flavours - X, Y and Z. The production of three flavours over a period of six years has been expressed in the bar graph provided below.
Production of Three Different Flavours X, Y and Z by a Company over the years (in lakh bottles)
3.
What is the difference between the average production of flavour X in 1995, 1996 and 1997 and the average production of flavour Y in 1998, 1999 and 2000?
Answer: Option
Explanation:
Average production of flavour X in 1995, 1996 and 1997
| = |  |
1 | x (50 + 40 + 55) | ![]](/_files/images/data-interpretation/common/15-sym-cbracket-h1.gif) |
| 3 |
| = |  |
145 |  |
lakh bottles. |
| 3 |
Average production of flavour Y in 1998, 1999 and 2000
| = | |
1 | x (55 + 50 + 55) | |
| 3 |
| = | |
160 | |
lakh bottles. |
| 3 |
 Difference Difference |
|
||||||||
|
|||||||||
| = 5 lakh bottles | |||||||||
| = 5,00,000 bottles. |
Discussion:
Be the first person to comment on this question !
Post your comments here:
Quick links
Quantitative Aptitude
Verbal (English)
Reasoning
Programming
Interview
Placement Papers