Data Interpretation - Bar Charts - Discussion
Discussion Forum : Bar Charts - Bar Chart 8 (Q.No. 1)
Directions to Solve
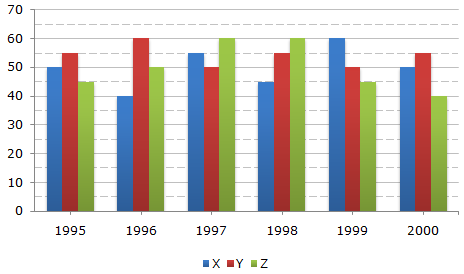
A soft drink company prepares drinks of three different flavours - X, Y and Z. The production of three flavours over a period of six years has been expressed in the bar graph provided below.
Production of Three Different Flavours X, Y and Z by a Company over the years (in lakh bottles)
1.
The total production of flovour Z in 1997 and 1998 is what percentage of the total production of flavour X in 1995 and 1996?
Answer: Option
Explanation:
| Required percentage |
|
|||||||
|
||||||||
| = 133.33%. |

![]](/_files/images/data-interpretation/common/15-sym-cbracket-h1.gif)
Discussion:
5 comments Page 1 of 1.
Vivi said:
1 year ago
The denominator should be 95 instead of 90. Then the answer will be 126.31.
Eichi said:
2 years ago
Yes, it should be 95.
(1)
Preti said:
10 years ago
@Shivu : No, it's 90. Check the graph, blue bars are for flavour X in 1995 and 1996 is (50 & 40)
@Vijhay:
Total production of flavour Z (green bars) in 1997 and 1998 is = 60 + 60 = 120.
Total production of flavour X (blue bars) in 1995 and 1996 is = 50 + 40 = 90.
Given: Tot Prdctn of flavour Z in 1997 and 1998 = x% of total production of flavour X in 1995 and 1996.
120 = x% of 90.
x = [(120 * 100) /90] = 133.33%.
Thank you
Vijhay said:
10 years ago
I can't understand this, someone help me.
Shivu chauhan said:
1 decade ago
It should be 95 (the denominator).
(2)
Post your comments here:
Quick links
Quantitative Aptitude
Verbal (English)
Reasoning
Programming
Interview
Placement Papers