Data Interpretation - Bar Charts - Discussion
Discussion Forum : Bar Charts - Bar Chart 4 (Q.No. 2)
Directions to Solve
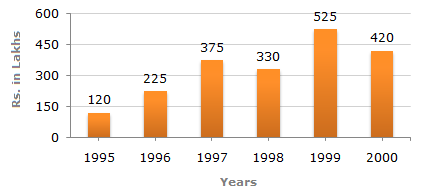
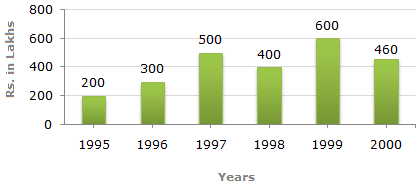
Out of the two bar graphs provided below, one shows the amounts (in Lakh Rs.) invested by a Company in purchasing raw materials over the years and the other shows the values (in Lakh Rs.) of finished goods sold by the Company over the years.
Amount invested in Raw Materials (Rs. in Lakhs)
Value of Sales of Finished Goods (Rs. in Lakhs)
2.
The value of sales of finished goods in 1999 was approximately what percent of the sum of amount invested in Raw materials in the years 1997, 1998 and 1999?
Answer: Option
Explanation:
| Required percentage |
|
|||||||
| = 48.78% | ||||||||
 49%. 49%. |

![]](/_files/images/data-interpretation/common/15-sym-cbracket-h1.gif)
Discussion:
4 comments Page 1 of 1.
Abhishek said:
3 years ago
@Vikash.
Kindly read the question properly here already mentioned.
"What per cent of the average amount invested in raw material in the years 1997, 1998, and 1999?
Kindly read the question properly here already mentioned.
"What per cent of the average amount invested in raw material in the years 1997, 1998, and 1999?
(1)
Vikash said:
4 years ago
@Akshay.
Here, not mentioned about "average". Then how you take it?
Here, not mentioned about "average". Then how you take it?
Akshay said:
6 years ago
It says the average amount invested. Shouldn't divide it by 3? please tell me.
Rashmi devi said:
8 years ago
Is the average of the amount invested in three years not required?
Post your comments here:
Quick links
Quantitative Aptitude
Verbal (English)
Reasoning
Programming
Interview
Placement Papers