Data Interpretation - Bar Charts - Discussion
Discussion Forum : Bar Charts - Bar Chart 3 (Q.No. 4)
Directions to Solve
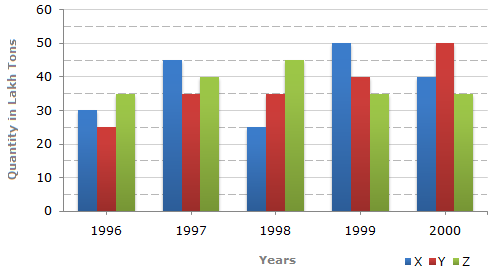
The bar graph given below shows the data of the production of paper (in lakh tonnes) by three different companies X, Y and Z over the years.
Production of Paper (in lakh tonnes) by Three Companies X, Y and Z over the Years.
4.
In which year was the percentage of production of Company Z to the production of Company Y the maximum?
Answer: Option
Explanation:
The percentages of production of Company Z to the production of Company Z for various years are:
| For 1996 = |  |
35 | x 100 |  |
% = 140%. |
| 25 |
| For 1997 = | |
40 | x 100 | |
% = 114.29%. |
| 35 |
| For 1998 = | |
45 | x 100 | |
% = 128.57%. |
| 35 |
| For 1999 = | |
35 | x 100 | |
% = 87.5%. |
| 40 |
| For 2000 = | |
35 | x 100 | |
% = 70%. |
| 50 |
Clearly, this percentage is highest for 1996.
Discussion:
2 comments Page 1 of 1.
Ashwini said:
8 years ago
Here, the Formula is: (final value-initial value) /initial value * 100.
Venu said:
1 decade ago
When ever we see this type of problems we can do like this.
Just observe above graph no need to calculate last two years because those are negative sign.
35-25/35*100 = 28.57%.
Note: Follow this formula (initial value-second value)/initial value*100.
Just observe above graph no need to calculate last two years because those are negative sign.
35-25/35*100 = 28.57%.
Note: Follow this formula (initial value-second value)/initial value*100.
Post your comments here:
Quick links
Quantitative Aptitude
Verbal (English)
Reasoning
Programming
Interview
Placement Papers