Data Interpretation - Bar Charts - Discussion
Discussion Forum : Bar Charts - Bar Chart 3 (Q.No. 5)
Directions to Solve
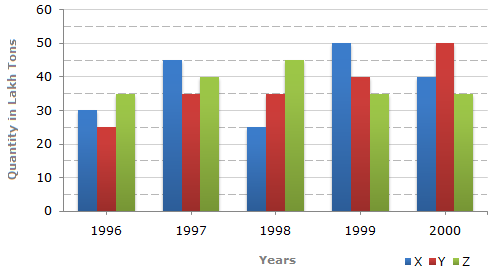
The bar graph given below shows the data of the production of paper (in lakh tonnes) by three different companies X, Y and Z over the years.
Production of Paper (in lakh tonnes) by Three Companies X, Y and Z over the Years.
5.
What is the percentage increase in the production of Company Y from 1996 to 1999?
Answer: Option
Explanation:
Percentage increase in the production of Company Y from 1996 to 1999
| = |  |
(40 - 25) | x 100 | ![]](/_files/images/data-interpretation/common/15-sym-cbracket-h1.gif) |
% |
| 25 |
| = | |
15 | x 100 | |
% |
| 25 |
= 60%.
Discussion:
9 comments Page 1 of 1.
Sham said:
5 years ago
No, We get only 40% why because (35-25)/25.
So, we get 40%, not 60 percent.
So, we get 40%, not 60 percent.
Rekha Manivannan said:
9 years ago
Hi, there we have taken only 96-year and 99-year of the company. Where as the question says from year 96 to 99. Please clarify it.
Jaimin Sojitra said:
9 years ago
Thank you all for explaining it.
Prabu said:
9 years ago
If the values changed in each year randomly (increase and decrease) for that also have to calculate final year value - initial value/initial value * 100 is only the formula?
Vrutika patel said:
10 years ago
Why you take 25 as denominator?
(2)
Bilal shah said:
10 years ago
Percentage change formula: final value - initial value/initial value * 100.
Aparna said:
1 decade ago
(current profit)-(previous year profit)/(previous year profit)*100.
(1)
Jaimin Sojitra said:
1 decade ago
Please Explain why did take 25 in denominator?
(1)
Naren said:
1 decade ago
Can any one explain regarding the base which I have to take.
Either 25 or 40 and why please?
Either 25 or 40 and why please?
Post your comments here:
Quick links
Quantitative Aptitude
Verbal (English)
Reasoning
Programming
Interview
Placement Papers