Data Interpretation - Bar Charts - Discussion
Discussion Forum : Bar Charts - Bar Chart 15 (Q.No. 5)
Directions to Solve
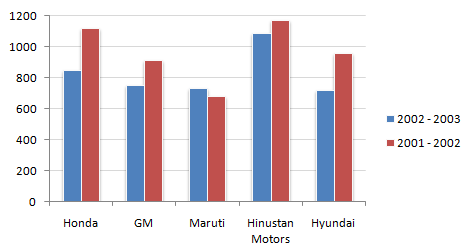
Study the following bar chart and answer the questions carefully.
Sales Turnover of 5 Companies (in Rs. crores)
5.
What is the approximate difference between the average sales turnover of all the companies put together between the years 2001 - 2002 and 2002 - 2003 ?
Answer: Option
Explanation:
Difference between the sum of the two years divided by 5.
Discussion:
7 comments Page 1 of 1.
Vishakha said:
2 months ago
It is 133.2 approx.
Ashish said:
10 months ago
2001 and 2002: 1100 + 900 + 650 + 1150 + 950 = 4750.
2002 and 2003: 850 + 750 + 700 + 1100 + 700 = 4100.
4750 - 4100 = 650,
650/5 = 130.
Here we have to find out approx so the answer is (a)133.45,
Or you can say Option (d).
2002 and 2003: 850 + 750 + 700 + 1100 + 700 = 4100.
4750 - 4100 = 650,
650/5 = 130.
Here we have to find out approx so the answer is (a)133.45,
Or you can say Option (d).
Suraj Sarkar said:
3 years ago
2001-02:(1100 + 900 + 650 + 1150 + 950) = 4750.
2002-03:(850 + 750 + 900 + 1050 + 7000) = 4250.
Difference = (4750-4250)/5 = 100.
2002-03:(850 + 750 + 900 + 1050 + 7000) = 4250.
Difference = (4750-4250)/5 = 100.
(2)
Kp Sharma said:
3 years ago
Please explain the correct answer in detail.
Deepu said:
6 years ago
It must be none of these option D.
Kasinath @Hyd said:
1 decade ago
2001-02:(1100+900+650+1150+950) = 3750. Avg = 3750/5
2002-03: 3050. Avg = 3050/5.
Difference = (3750-3050)/5 = 140.
2002-03: 3050. Avg = 3050/5.
Difference = (3750-3050)/5 = 140.
(4)
Swojeena shrestha said:
1 decade ago
Since there is not given number to calculate exact turnover in number. So, how can we determine answer, even in point?
(5)
Post your comments here:
Quick links
Quantitative Aptitude
Verbal (English)
Reasoning
Programming
Interview
Placement Papers