Data Interpretation - Line Charts - Discussion
Discussion Forum : Line Charts - Line Chart 9 (Q.No. 2)
Directions to Solve
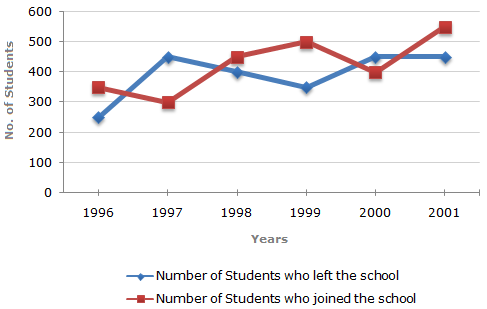
Study the following line graph which gives the number of students who joined and left the school in the beginning of year for six years, from 1996 to 2001.
Initial Strength of school in 1995 = 3000.
2.
For which year, the percentage rise/fall in the number of students who left the school compared to the previous year is maximum?
Answer: Option
Explanation:
The percentage rise/fall in the number of students who left the school (compared to the previous year) during various years are:
| For 1997 = |  |
(450 - 250) | x 100 | ![]](/_files/images/data-interpretation/common/15-sym-cbracket-h1.gif) |
% = 80% (rise). |
| 250 |
| For 1998 = | |
(450 - 400) | x 100 | |
% = 11.11% (fall). |
| 450 |
| For 1999 = | |
(400 - 350) | x 100 | |
% = 12.5% (fall). |
| 400 |
| For 2000 = | |
(450 - 350) | x 100 | |
% = 28.57% (rise). |
| 350 |
| For 2001 = | |
(450 - 450) | x 100 | |
% = 0%. |
| 450 |
Clearly, the maximum percentage rise/fall is for 1997.
Discussion:
3 comments Page 1 of 1.
Hari gopal said:
2 months ago
Thanks for explaining @Destro.
Destro said:
3 years ago
First it takes 1996 students left (S1)= 250, and in 1997 (S2)= 450.
So,
S2-S1/S1 * 100.
450-250/250 * 100 = 80%,
And S3-S2/S2*100, 400-450/450*100 = -11%.
So,
S2-S1/S1 * 100.
450-250/250 * 100 = 80%,
And S3-S2/S2*100, 400-450/450*100 = -11%.
(2)
Norbu said:
6 years ago
How we know whether it is rise or fall? please explain to me.
Post your comments here:
Quick links
Quantitative Aptitude
Verbal (English)
Reasoning
Programming
Interview
Placement Papers