Data Interpretation - Line Charts - Discussion
Discussion Forum : Line Charts - Line Chart 9 (Q.No. 6)
Directions to Solve
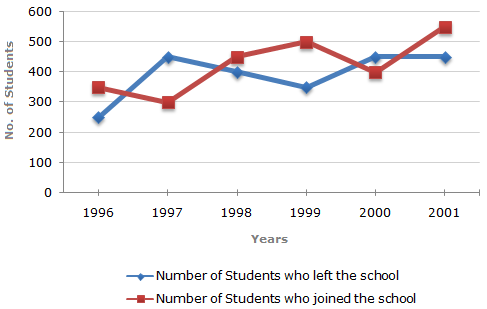
Study the following line graph which gives the number of students who joined and left the school in the beginning of year for six years, from 1996 to 2001.
Initial Strength of school in 1995 = 3000.
6.
During which of the following pairs of years, the strength of the school was same?
Answer: Option
Explanation:
As calculated above, in the years 1996 and 2000 the strength of the school was same i.e., 3100.
Discussion:
6 comments Page 1 of 1.
Manas M said:
5 years ago
1995 = 3000 (given).
In 1996 = 3000 - 250 + 350 = 3100.
In 1997 = 3100 - 450 + 300 = 2950.
In 1998 = 2950 - 400 + 450 = 3000.
In 1999 = 3000 - 350 + 500 = 3150.
In 2000 = 3150 - 450 + 400 = 3100.
In 2001 = 3100 - 450 + 550 = 3200.
In 1996 = 3000 - 250 + 350 = 3100.
In 1997 = 3100 - 450 + 300 = 2950.
In 1998 = 2950 - 400 + 450 = 3000.
In 1999 = 3000 - 350 + 500 = 3150.
In 2000 = 3150 - 450 + 400 = 3100.
In 2001 = 3100 - 450 + 550 = 3200.
(1)
Fnghi said:
5 years ago
I think the correct answer should be 1996 and 2001, right?
The strength of the school in 1996 and 2001 was 3,100.
The strength of the school in 1996 and 2001 was 3,100.
Sangay Zangmo said:
6 years ago
Here, option D it comes 3100 in 1996 but for the year 2000, it comes 2950. How come answer? Please explain.
TSHOKEY said:
6 years ago
In the 2000 year, the total strength of students is 3100 alike 1996. Am I right?
(1)
Liza said:
1 decade ago
What is the formula to come up with letter D, 1996 and 2000?
Sangay Zangmo said:
6 years ago
Please explain the answer.
Post your comments here:
Quick links
Quantitative Aptitude
Verbal (English)
Reasoning
Programming
Interview
Placement Papers