Data Interpretation - Line Charts - Discussion
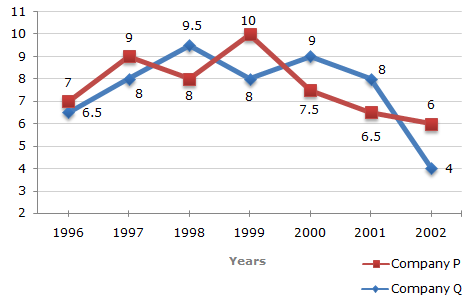
Two different finance companies declare fixed annual rate of interest on the amounts invested with them by investors. The rate of interest offered by these companies may differ from year to year depending on the variation in the economy of the country and the banks rate of interest. The annual rate of interest offered by the two Companies P and Q over the years are shown by the line graph provided below.
Annual Rate of Interest Offered by Two Finance Companies Over the Years.
Amount received from Company P after one year (i.e., in 199) on investing Rs. 12 lakhs in it
= Rs. [12 + (8% of 12)] lakhs
= Rs. 12.96 lakhs.
Amount received from Company P after one year on investing Rs. 12.96 lakhs in the year 1999
= Rs. [12.96 + (10% of 12.96)] lakhs
= Rs. 14.256.
Appreciation received on investment during the period of two years
= Rs. (14.256 - 12) lakhs
= Rs. 2.256 lakhs
= Rs. 2,25,600.
Why 8% in first step turned into 10% in next step?
Can you please elaborate it.
= Rs. (14.256 - 12) lakhs please explain.
So interest amount received = 96000 (= 1200000 * 0.08) .
Net amount after investment = 1296000 (=1200000 + 96000) .
Next year 1999, interest rate = 0.1,
Amount invested = 1296000,
Interest received = 1296000 * 0.1= 129600.
Total interest (appreciation) = interest in (1998 + 1999) = 96000 + 129600 = 225600 => Answer.
Net interest rate: 8+10+(8*10/100) = 18.8% -- this would be the combined interest for two years.
Interest or appreciation: 12 * 18.8/100 = 225.6/100 = 2.256.
The answer is = 1425600-1200000 = 225600.