Data Interpretation - Line Charts - Discussion
Discussion Forum : Line Charts - Line Chart 6 (Q.No. 3)
Directions to Solve
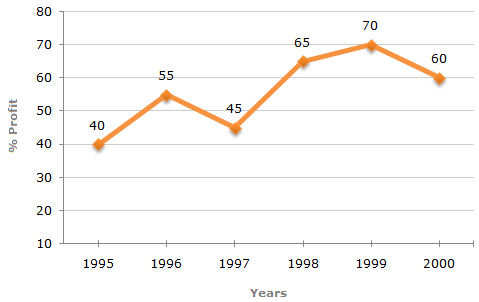
The following line graph gives the annual percent profit earned by a Company during the period 1995 - 2000.
Percent Profit Earned by a Company Over the Years.
| %Profit = | Income - Expenditure | x 100 |
| Expenditure |
3.
In which year is the expenditure minimum?
Answer: Option
Explanation:
The line-graph gives the comparison of percent profit for different years bu the comparison of the expenditures is not possible without more data.
Therefore, the year with minimum expenditure cannot be determined.
Discussion:
1 comments Page 1 of 1.
Payel said:
4 years ago
Expenditure is minimum where profit percentage is maximum. So, it must be 1999.
(1)
Post your comments here:
Quick links
Quantitative Aptitude
Verbal (English)
Reasoning
Programming
Interview
Placement Papers