Data Interpretation - Line Charts - Discussion
Discussion Forum : Line Charts - Line Chart 6 (Q.No. 2)
Directions to Solve
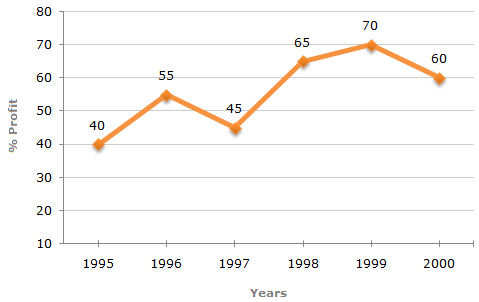
The following line graph gives the annual percent profit earned by a Company during the period 1995 - 2000.
Percent Profit Earned by a Company Over the Years.
| %Profit = | Income - Expenditure | x 100 |
| Expenditure |
2.
If the income in 1998 was Rs. 264 crores, what was the expenditure in 1998?
Answer: Option
Explanation:
Let the expenditure is 1998 be Rs. x crores.
| Then, 65 = | 264 - x | x 100 |
| x |
 |
65 | = | 264 | - 1 |
| 100 | x |
| x = |
264 x 100 | = 160. |
| 165 |
 Expenditure in 1998 = Rs. 160 crores.
Discussion:
10 comments Page 1 of 1.
Vish said:
1 decade ago
Can anyone please tell me how 65 became 165 in denominator.
(1)
Ashwini said:
8 years ago
%Profit = (Income-Expenditure)/Expenditure * 100 .
Let expenditure=x.
65=(264-x)/x * 100,
65= (264/x - 1) * 100,
65 = (264/x)*100 - 100,
65+100x = 264*100,
x=(264*100)/165,
x=160.
Let expenditure=x.
65=(264-x)/x * 100,
65= (264/x - 1) * 100,
65 = (264/x)*100 - 100,
65+100x = 264*100,
x=(264*100)/165,
x=160.
(1)
Jegapriya said:
1 decade ago
65/100+1 = 264/x.
65+100/100 = 264/x (cross multiplication).
165/100 = 264/x.
x = 264x100/165.
x = 160.
65+100/100 = 264/x (cross multiplication).
165/100 = 264/x.
x = 264x100/165.
x = 160.
V a milton said:
1 decade ago
How that X became 1 kindly explain?
Payal said:
1 decade ago
Can you please explain why get x is a 1?
R J said:
9 years ago
Here, I = (100+%P)E/100.
Yeshi pema said:
7 years ago
Can anyone please explain from where that -1 came?
Lovely said:
7 years ago
To all who are asking why to take x as 1.
If we make the equation separate in two parts then 2nd part will become x/x, i.e. = 1.
If we make the equation separate in two parts then 2nd part will become x/x, i.e. = 1.
Yeshey Zangmo said:
6 years ago
How -1 came? Please explain to me.
Hajji said:
1 year ago
Thanks for the explanation @Ashwini.
Post your comments here:
Quick links
Quantitative Aptitude
Verbal (English)
Reasoning
Programming
Interview
Placement Papers