Data Interpretation - Line Charts - Discussion
Discussion Forum : Line Charts - Line Chart 4 (Q.No. 2)
Directions to Solve
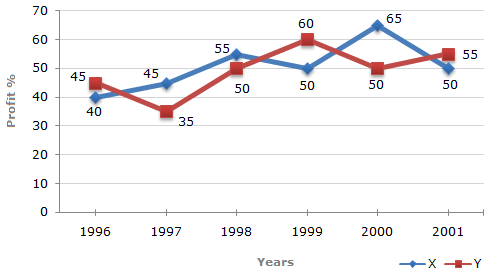
The following line graph gives the percent profit earned by two Companies X and Y during the period 1996 - 2001.
Percentage profit earned by Two Companies X and Y over the Given Years
| %Profit = | Income - Expenditure | x 100 |
| Expenditure |

2.
If the expenditure of Company Y in 1997 was Rs. 220 crores, what was its income in 1997 ?
Answer: Option
Explanation:
Profit percent of Company Y in 1997 = 35.
Let the income of Company Y in 1997 be Rs. x crores.
| Then, 35 = | x - 220 | x 100  x = 297. x = 297. |
| 220 |
 Income of Company Y in 1997 = Rs. 297 crores.
Discussion:
9 comments Page 1 of 1.
Ali and shoaib said:
1 year ago
Great, Thanks @Varshini.
Varshini said:
5 years ago
35 = [(x-220)/220*100].
35/100 = (x-220)/220.
(35/100)*220 = x - 220,
0.35*220 = x-220,
77 = x-220,
x = 220 + 77,
x = 297.
35/100 = (x-220)/220.
(35/100)*220 = x - 220,
0.35*220 = x-220,
77 = x-220,
x = 220 + 77,
x = 297.
(9)
Raju said:
7 years ago
Anyone, please explain the given chart.
Sara said:
8 years ago
@Jija.
It's given in the chart. Please check it.
It's given in the chart. Please check it.
Jija said:
9 years ago
How 35 comes?
(1)
Sandeep said:
1 decade ago
220 of 135% = 297.
(4)
Swathi said:
1 decade ago
35 = x-220/220*100.
x-220/220 = 35/100.
x-220/220 = 7/20.
20x-4400 = 1540.
20x = 1540+4400.
20x = 5940.
x = 5940/20.
x = 297.
x-220/220 = 35/100.
x-220/220 = 7/20.
20x-4400 = 1540.
20x = 1540+4400.
20x = 5940.
x = 5940/20.
x = 297.
Kumar said:
1 decade ago
See here,
35 = (x/220-220/220)*100.
35 = (x/220-1)*100.
35/100 = x/220 -1.
35/100+1 = x/220.
135/100 = x/220.
135100*220 = x.
297 = x.
35 = (x/220-220/220)*100.
35 = (x/220-1)*100.
35/100 = x/220 -1.
35/100+1 = x/220.
135/100 = x/220.
135100*220 = x.
297 = x.
Ramrsh said:
1 decade ago
Please explain me.
35 = ((X-200)/220)*100.
X = 297.
35 = ((X-200)/220)*100.
X = 297.
Post your comments here:
Quick links
Quantitative Aptitude
Verbal (English)
Reasoning
Programming
Interview
Placement Papers