Data Interpretation - Line Charts - Discussion
Discussion Forum : Line Charts - Line Chart 3 (Q.No. 2)
Directions to Solve
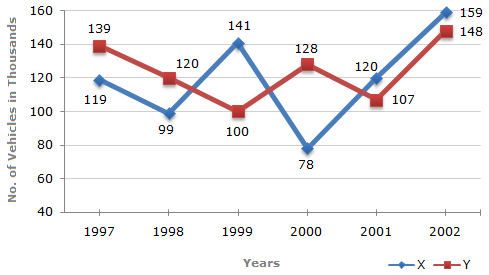
Study the following line graph and answer the questions based on it.
Number of Vehicles Manufactured by Two companies ove the Years (Number in Thousands)
2.
What is the difference between the total productions of the two Companies in the given years ?
Answer: Option
Explanation:
From the line-graph it is clear that the productions of Company X in the years 1997, 1998, 1999, 2000, 2001 and 2002 are 119000, 99000, 141000, 78000, 120000 and 159000 and those of Company Y are 139000, 120000,100000, 128000, 107000 and 148000 respectively.
Total production of Company X from 1997 to 2002
= 119000 + 99000 + 141000 + 78000 + 120000 + 159000
= 716000.
and total production of Company Y from 1997 to 2002
= 139000 + 120000 + 100000 + 128000 + 107000 + 148000
= 742000.
Difference = (742000 - 716000) = 26000.
Discussion:
2 comments Page 1 of 1.
Zakaria said:
1 decade ago
You can calculate this way-
difference of each year= 20+21-41+50-13-11=26
Ans= 26 thousand.
difference of each year= 20+21-41+50-13-11=26
Ans= 26 thousand.
(1)
Prachi thote said:
6 years ago
119000 + 99000 + 141000 + 78000 + 120000 + 159000 = 796000.
So the difference is 54000.
So the difference is 54000.
Post your comments here:
Quick links
Quantitative Aptitude
Verbal (English)
Reasoning
Programming
Interview
Placement Papers