Data Interpretation - Line Charts - Discussion
Discussion Forum : Line Charts - Line Chart 2 (Q.No. 4)
Directions to Solve
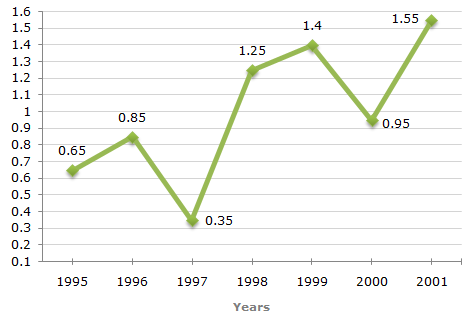
The following line graph gives the ratio of the amounts of imports by a company to the amount of exports from that company over the period from 1995 to 2001.
Ratio of Value of Imports to Exports by a Company Over the Years.
4.
If the imports of the company in 1996 was Rs. 272 crores, the exports from the company in 1996 was ?
Answer: Option
Explanation:
Ratio of imports to exports in the year 1996 = 0.85.
Let the exports in 1996 = Rs. x crores.
| Then, | 272 | = 0.85  x = x = |
272 | = 320. |
| x | 0.85 |
 Exports in 1996 = Rs. 320 crores.
Discussion:
2 comments Page 1 of 1.
Ashwini said:
9 years ago
In question only they have given import of the company in 1996 was 272. And also there is a formula import/export.
Subha said:
10 years ago
How did 272 came?
Post your comments here:
Quick links
Quantitative Aptitude
Verbal (English)
Reasoning
Programming
Interview
Placement Papers