Data Interpretation - Line Charts
Exercise : Line Charts - Bar Chart 3
- Line Charts - Bar Chart 1
- Line Charts - Bar Chart 10
- Line Charts - Bar Chart 9
- Line Charts - Bar Chart 8
- Line Charts - Bar Chart 7
- Line Charts - Bar Chart 6
- Line Charts - Bar Chart 5
- Line Charts - Bar Chart 4
- Line Charts - Bar Chart 3
- Line Charts - Bar Chart 2
- Line Charts - Bar Chart 11
- Line Charts - Bar Chart 12
- Line Charts - Bar Chart 13
- Line Charts - Bar Chart 14
- Line Charts - Bar Chart 15
- Line Charts - Bar Chart 16
- Line Charts - Bar Chart 17
- Line Charts - Bar Chart 18
- Line Charts - Bar Chart 19
Directions to Solve
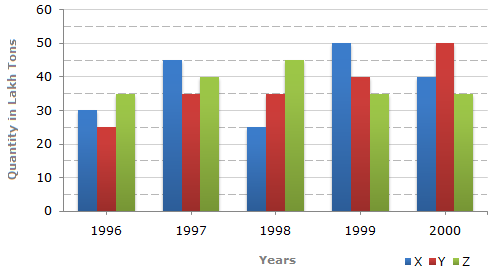
The bar graph given below shows the data of the production of paper (in lakh tonnes) by three different companies X, Y and Z over the years.
Production of Paper (in lakh tonnes) by Three Companies X, Y and Z over the Years.
6.
What is the difference between the production of Company Z in 1998 and Company Y in 1996?
Answer: Option
Explanation:
| Required difference | = [(45 - 25) x 1,00,000] tons |
| = 20,00,000 tons. |
Quick links
Quantitative Aptitude
Verbal (English)
Reasoning
Programming
Interview
Placement Papers