Data Interpretation - Line Charts
Exercise : Line Charts - Bar Chart 18
- Line Charts - Bar Chart 1
- Line Charts - Bar Chart 10
- Line Charts - Bar Chart 9
- Line Charts - Bar Chart 8
- Line Charts - Bar Chart 7
- Line Charts - Bar Chart 6
- Line Charts - Bar Chart 5
- Line Charts - Bar Chart 4
- Line Charts - Bar Chart 3
- Line Charts - Bar Chart 2
- Line Charts - Bar Chart 11
- Line Charts - Bar Chart 12
- Line Charts - Bar Chart 13
- Line Charts - Bar Chart 14
- Line Charts - Bar Chart 15
- Line Charts - Bar Chart 16
- Line Charts - Bar Chart 17
- Line Charts - Bar Chart 18
- Line Charts - Bar Chart 19
Directions to Solve
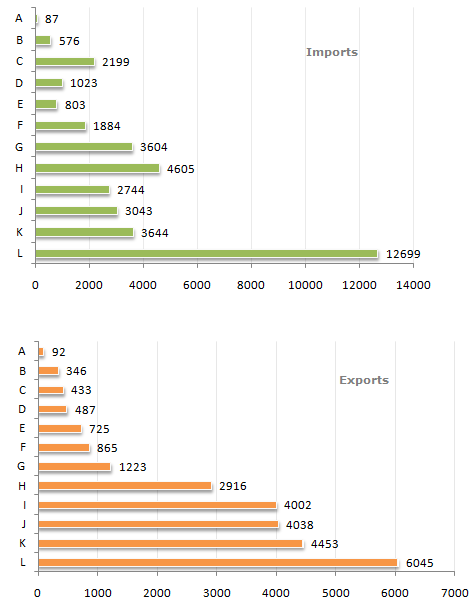
Study the following bar charts and answer the questions.
Foreign Trade (Imports and Exports) by countries for the year (1993 - 1994)
1.
The ratio of the maximum exports to the minimum imports was closest to ?
Answer: Option
Explanation:
The value of maximum exports = 6045.
The value of minimum imports = 87.
Therefore, the required ratio (6045/87) = 69.48 = 69 (approximately).
2.
How many countries exhibited a trade surplus ?
Answer: Option
Explanation:
Out of a total of 12 countries, 8 showed a deficit while 4 showed a surplus.
3.
The total trade deficit/surplus for all the countries put together was ?
Answer: Option
Explanation:
Sum of exports - Sum of imports = deficit(11286).
4.
The highest trade deficit was shown by which country ?
Answer: Option
Explanation:
Visually its clear that L has the highest trade deficit.
5.
The ratio of Exports to Imports was highest for which country ?
Answer: Option
Explanation:
I has a ratio of 4002/2744 = 1.45, which is the highest.
Quick links
Quantitative Aptitude
Verbal (English)
Reasoning
Programming
Interview
Placement Papers