Data Interpretation - Bar Charts - Discussion
Discussion Forum : Bar Charts - Bar Chart 3 (Q.No. 1)
Directions to Solve
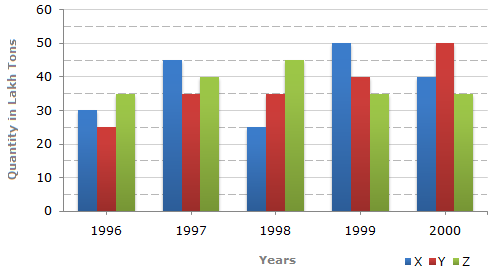
The bar graph given below shows the data of the production of paper (in lakh tonnes) by three different companies X, Y and Z over the years.
Production of Paper (in lakh tonnes) by Three Companies X, Y and Z over the Years.
1.
For which of the following years, the percentage rise/fall in production from the previous year is the maximum for Company Y?
Answer: Option
Explanation:
Percentage change (rise/fall) in the production of Company Y in comparison to the previous year, for different years are:
| For 1997 = |  |
(35 - 25) | x 100 | ![]](/_files/images/data-interpretation/common/15-sym-cbracket-h1.gif) |
% = 40%. |
| 25 |
| For 1998 = | |
(35 - 35) | x 100 | |
% = 0%. |
| 35 |
| For 1999 = | |
(40 - 35) | x 100 | |
% = 14.29%. |
| 35 |
| For 2000 = | |
(50 - 40) | x 100 | |
% = 25%. |
| 40 |
Hence, the maximum percentage rise/fall in the production of Company Y is for 1997.
Discussion:
12 comments Page 2 of 2.
Shilpi said:
2 decades ago
Can you please explain why is it divided by 25, 25, 35, 40?
Shruthi said:
2 decades ago
I want to know how is data taken as 32 for 1997 and 35 for 1998 when it is shown clearly that for both years it is 35 please do explain.
Post your comments here:
Quick links
Quantitative Aptitude
Verbal (English)
Reasoning
Programming
Interview
Placement Papers