Data Interpretation - Bar Charts - Discussion
Discussion Forum : Bar Charts - Bar Chart 2 (Q.No. 3)
Directions to Solve
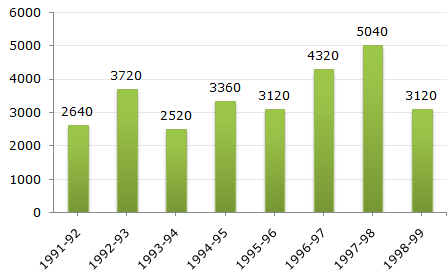
The bar graph given below shows the foreign exchange reserves of a country (in million US $) from 1991 - 1992 to 1998 - 1999.
Foreign Exchange Reserves Of a Country. (in million US $)
3.
For which year, the percent increase of foreign exchange reserves over the previous year, is the highest?
Answer: Option
Explanation:
There is an increase in foreign exchange reserves during the years 1992 - 1993, 1994 - 1995, 1996 - 1997, 1997 - 1998 as compared to previous year (as shown by bar-graph).
The percentage increase in reserves during these years compared to previous year are:
| For 1992 - 1993 = |  |
(3720 - 2640) | x 100 | ![]](/_files/images/data-interpretation/common/15-sym-cbracket-h1.gif) |
% = 40.91%. |
| 2640 |
| For 1994 - 1995 = | |
(3360 - 2520) | x 100 | |
% = 33.33%. |
| 2520 |
| For 1996 - 1997 = | |
(4320 - 3120) | x 100 | |
% = 38.46%. |
| 3120 |
| For 1997 - 1998 = | |
(5040 - 4320) | x 100 | |
% = 16.67%. |
| 4320 |
Clearly, the percentage increase over previous year is highest for 1992 - 1993.
Discussion:
15 comments Page 2 of 2.
Vishal said:
1 decade ago
Why the year 1996-97 is not the right answer?
Ileri said:
9 years ago
I still don't understand. Please help me.
Amit said:
1 decade ago
Can anyone give easier method for this?
Preeti said:
1 decade ago
Why not take the 98-99 amount of 3120?
Zomoroda said:
10 years ago
Why not 1997-98 is the right answer?
Post your comments here:
Quick links
Quantitative Aptitude
Verbal (English)
Reasoning
Programming
Interview
Placement Papers