Data Interpretation - Bar Charts - Discussion
Discussion Forum : Bar Charts - Bar Chart 1 (Q.No. 1)
Directions to Solve
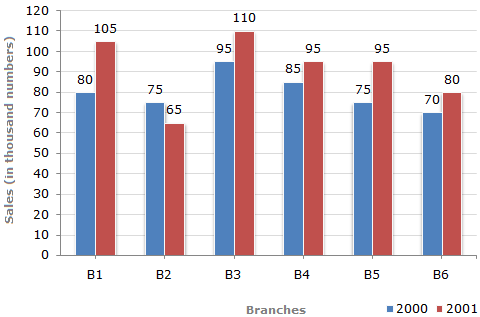
The bar graph given below shows the sales of books (in thousand number) from six branches of a publishing company during two consecutive years 2000 and 2001.
Sales of Books (in thousand numbers) from Six Branches - B1, B2, B3, B4, B5 and B6 of a publishing Company in 2000 and 2001.
1.
What is the ratio of the total sales of branch B2 for both years to the total sales of branch B4 for both years?
Answer: Option
Explanation:
| Required ratio = | (75 + 65) | = | 140 | = | 7 | . |
| (85 + 95) | 180 | 9 |
Discussion:
28 comments Page 2 of 3.
Sai Shankar said:
8 years ago
How come 7/9?
(2)
Praveena said:
9 years ago
Why to take 75 and 65 is numerator? Please explain.
(2)
Jun jun said:
10 years ago
Where did you get the 75, 65, and 85, 95? Please explain me?
(2)
Pratham said:
10 years ago
Nice explanation. Thank you all.
(2)
Puto said:
1 decade ago
Someone please explain me clearly.
(2)
Mansani said:
1 decade ago
75 + 65/85 + 95 = 140/180.
=7/9 => i.e 7 : 9.
=7/9 => i.e 7 : 9.
(2)
Vishnu said:
9 years ago
Why to take 75 and 65 is numerator?
(1)
Ileri said:
9 years ago
Can someone explain how we got 7/9?
(1)
Pavani said:
8 years ago
They asked total sales of B2 to the total sales of B4 so we took B2 in the numerator.
(1)
KHYATEESHWAR KANAPARTHY said:
1 week ago
140 :180{sum of b2 and b4 in 2 years}cancellation.
So, we get 70:90 --->7:9.
So, we get 70:90 --->7:9.
Post your comments here:
Quick links
Quantitative Aptitude
Verbal (English)
Reasoning
Programming
Interview
Placement Papers