Data Interpretation - Bar Charts - Discussion
Discussion Forum : Bar Charts - Bar Chart 13 (Q.No. 4)
Directions to Solve
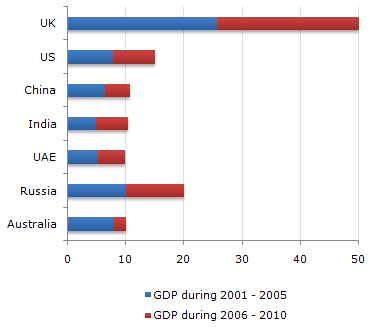
The following bar chart represents the GDP of different countries during the half decades 2001 - 2005 and 2006 - 2010. All figures are in Rs. billion.
GDP of Various Countries
4.
Out of every Rs. 10,000 spent during the decade 2001 - 2010 approximately how much was the GDP of Russia during the half decade 2001 - 2005 ?
Answer: Option
Explanation:
Russia will account for 10 out of 125, i.e, 8% of the total, i.e, 800 out of 10,000 (approximately values based on visual interpretation).
Discussion:
10 comments Page 1 of 1.
Gursimar Singh said:
5 years ago
Thank you for explaining @Manish.
(1)
Sayli said:
5 years ago
Thanks for explaining.
Amy said:
6 years ago
Thanks for explaining @Manish.
Swapnil said:
1 decade ago
Language of the question is a bit odd, especially "out of every 10000 spent" it should be different.
Manish said:
1 decade ago
Guys Here is the answer:
See the question here is a bit tricky:
Its saying that if 10,000 is for whole for a decade for everyone.
Than Russia's share for 5 years.
So Include everything like Bharat said - (50+15+10+10+10+20+10 = 125).
And than see the Bar: Russia's First 5 Years during the half decade 2001 - 2005 = 10 points so,
We have 10 out of 125.
(7)
Sachin said:
1 decade ago
From where did it 125 come? Why in the answer its written 10 out of 125?
Explain in detail.
Explain in detail.
(2)
Bharath said:
1 decade ago
The only way I could think of arriving at 125 is to approximately add all the gdp's from UK to Aus (50+15+10+10+10+20+10 = 125).
(1)
Sriram said:
1 decade ago
Can any body explain this puzzle?
Lkpoir said:
1 decade ago
How to rate a chart?
I mean what can be rated about the gdp of russia for example?
I mean what can be rated about the gdp of russia for example?
Vandna said:
2 decades ago
From where did it 125 come? Why in the answer its written 10 out of 125?
Post your comments here:
Quick links
Quantitative Aptitude
Verbal (English)
Reasoning
Programming
Interview
Placement Papers