Data Interpretation - Bar Charts - Discussion
Discussion Forum : Bar Charts - Bar Chart 13 (Q.No. 1)
Directions to Solve
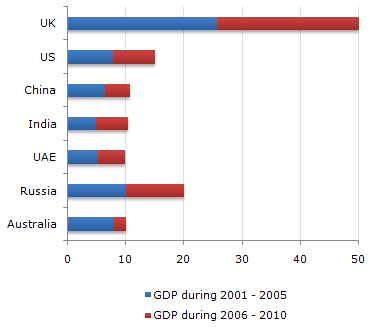
The following bar chart represents the GDP of different countries during the half decades 2001 - 2005 and 2006 - 2010. All figures are in Rs. billion.
GDP of Various Countries
1.
Which of the countries listed below accounts for the maximum GDP during the half decade 2006 to 2010 ?
Answer: Option
Explanation:
It's clear that US is the highest amongst the given options.
Discussion:
9 comments Page 1 of 1.
Sonowal said:
4 years ago
I am not understanding this. Please explain.
(1)
Shivam panchbhai said:
6 years ago
I agree with you @Gavin.
Gavin said:
7 years ago
UK should be the correct answer.
Phub said:
1 decade ago
May be because UK is not given in the option.
Samuel said:
1 decade ago
Based on the country listed below, us is the highest since russia and uk is not listed in the answers.
D J said:
1 decade ago
It is asked which countries listed below , according to the question it's the US, if it was asked among all the countries then it would have been the UK....
Puloma said:
1 decade ago
Please explain how it came. I didn't understand it.
Parul said:
2 decades ago
How it came? I didn't understand.
BhargaV said:
2 decades ago
How US ????
Half decade means 5 yrs...
Half decade means 5 yrs...
Post your comments here:
Quick links
Quantitative Aptitude
Verbal (English)
Reasoning
Programming
Interview
Placement Papers