Data Interpretation - Pie Charts - Discussion
Discussion Forum : Pie Charts - Pie Chart 4 (Q.No. 2)
Directions to Solve
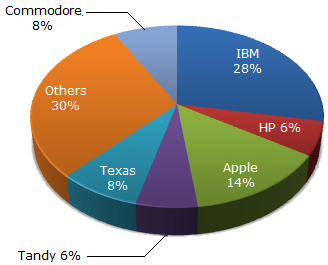
The pie chart shows the distribution of New York market share by value of different computer companies in 2005.
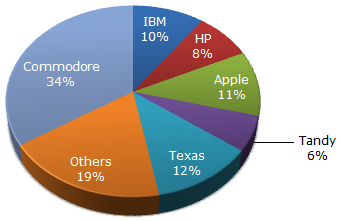
The pie chart shows the distribution of New York market share by volume of different computer companies in 2005.
Number of units sold in 2005 in New York = 1,500
Value of units sold in 2005 in New York = US $1,650,000.
2.
Over the period 2005-2006, if sales (value-wise) of IBM PC's increased by 50% and of Apple by 15% assuming that PC sales of all other computer companies remained the same, by what percentage (approximately) would the PC sales in New York (value-wise) increase over the same period ?
Answer: Option
Explanation:
If we assume the total sales to be 100 in the first year, IBM's sales would go up by 50% (from 28 to 42) contributing an increase of 14 to the total sales value.
Similarly, Apple's increase of 15% would contribute an increase of 2.1 to the total sales value. The net change would be 14 + 2.1 on 100. (i.e., 16.1%)
Discussion:
24 comments Page 2 of 3.
Nafeesa said:
8 years ago
@All.
50% increase means 150 (50+100) and 15% means 115.
50% increase means 150 (50+100) and 15% means 115.
Ashwini said:
8 years ago
Can you please explain how did you get 150 and 115?
Amisha said:
8 years ago
Thanks @Avani.
Varun said:
1 decade ago
Can any one can explain me this question in detail please?
BhaSkar said:
9 years ago
Thanks @Anoop.
Bill said:
9 years ago
Thanks @Anoop & @Avani.
Divya Mohana said:
9 years ago
From where did 28 come?
Inayat said:
10 years ago
The answer should be D here "None of these".
The chart shows market share in %, all percentages together is 100%. Somehow total share should not exceed more than 100%. All companies together market share should be 100%. In this case, when sale % increases market share is gone to 116.1% which will not be correct.
If you want to balance, other companies market share to be reduced to balance to 100%. So the answer can be D.
If I'm wrong please explain me in a little better way how the answer is A?
Shivani said:
10 years ago
Please explain the method to solve the question.
Reena said:
1 decade ago
Because they have specified it to be in terms of value.
Post your comments here:
Quick links
Quantitative Aptitude
Verbal (English)
Reasoning
Programming
Interview
Placement Papers