Data Interpretation - Line Charts - Discussion
Discussion Forum : Line Charts - Line Chart 4 (Q.No. 1)
Directions to Solve
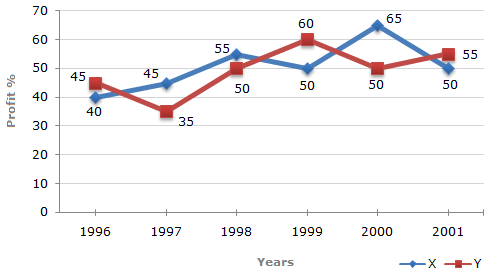
The following line graph gives the percent profit earned by two Companies X and Y during the period 1996 - 2001.
Percentage profit earned by Two Companies X and Y over the Given Years
| %Profit = | Income - Expenditure | x 100 |
| Expenditure |
1.
The incomes of two Companies X and Y in 2000 were in the ratio of 3:4 respectively. What was the respective ratio of their expenditures in 2000 ?
Answer: Option
Explanation:
Let the incomes in 2000 of Companies X and Y be 3x and 4x respectively.
And let the expenditures in 2000 of Companies X and Y be E1 and E2 respectively.
Then, for Company X we have:
| 65 = | 3x - E1 | x 100  |
65 | = | 3x | - 1 E1 = 3x x |
 |
100 |  |
.... (i) |
| E1 | 100 | E1 | 165 |
For Company Y we have:
| 50 = | 4x - E2 | x 100 |
50 | = | 4x | - 1 E2 = 4x x |
|
100 | |
.... (ii) |
| E2 | 100 | E2 | 150 |
From (i) and (ii), we get:
| E1 | = |
|
= | 3 x 150 | = | 15 | (Required ratio). | |||||
| E2 |
|
4 x 165 | 22 |
Discussion:
15 comments Page 2 of 2.
Twinkle said:
1 decade ago
Yes, same doubt for me. Where does the - 1 goes?
(1)
Abhi said:
1 decade ago
3x = 165.
4x = 150.
3x/165*150/4x = 15/22.
4x = 150.
3x/165*150/4x = 15/22.
(3)
Lavanya said:
9 years ago
@Prachi.
450/660=15:22?
450/660=15:22?
Rajeev said:
1 decade ago
Where does the -1 goes.
Raja naidu said:
1 decade ago
Where did that -1 go?
(2)
Post your comments here:
Quick links
Quantitative Aptitude
Verbal (English)
Reasoning
Programming
Interview
Placement Papers