Data Interpretation - Bar Charts - Discussion
Discussion Forum : Bar Charts - Bar Chart 2 (Q.No. 1)
Directions to Solve
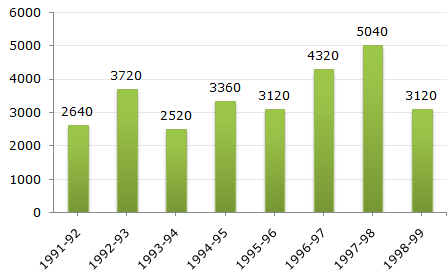
The bar graph given below shows the foreign exchange reserves of a country (in million US $) from 1991 - 1992 to 1998 - 1999.
Foreign Exchange Reserves Of a Country. (in million US $)
1.
The ratio of the number of years, in which the foreign exchange reserves are above the average reserves, to those in which the reserves are below the average reserves is?
Answer: Option
Explanation:
Average foreign exchange reserves over the given period = 3480 million US $.
The country had reserves above 3480 million US $ during the years 1992-93, 1996-97 and 1997-98, i.e., for 3 years and below 3480 million US $ during the years 1991-92, 1993-94, 1994-95, 1995-56 and 1998-99 i.e., for 5 years.
Hence, required ratio = 3 : 5.
Discussion:
17 comments Page 2 of 2.
Moni said:
8 years ago
Thanks for your brief explanation @Poonam.
Richa magar said:
8 years ago
Thank you for easily explanation @Poonam.
Sia said:
7 years ago
@Poonam.
Thanks for explaining nicely.
Thanks for explaining nicely.
Bunthi said:
2 decades ago
Can any one explain this clearly.
Navjodh said:
1 decade ago
Explain it clearly.
Isha said:
9 years ago
Very good @Poonam.
Khushi bajpai said:
6 years ago
Thanks @Poonam.
(1)
Post your comments here:
Quick links
Quantitative Aptitude
Verbal (English)
Reasoning
Programming
Interview
Placement Papers