Online Data Interpretation Test - Data Interpretation Test - Random
- This is a FREE online test. Beware of scammers who ask for money to attend this test.
- Total number of questions: 20.
- Time allotted: 30 minutes.
- Each question carries 1 mark; there are no negative marks.
- DO NOT refresh the page.
- All the best!
Marks : 2/20
Test Review : View answers and explanation for this test.
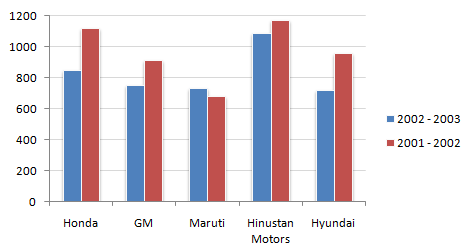
Study the following bar chart and answer the questions carefully.
Sales Turnover of 5 Companies (in Rs. crores)
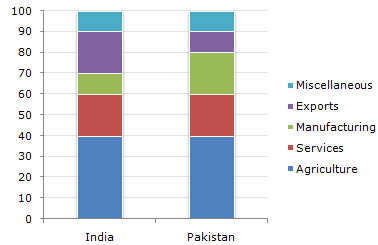
The following bar chart shows the composition of the GDP two countries (India and Pakistan).
Composition of GDP of Two Countries
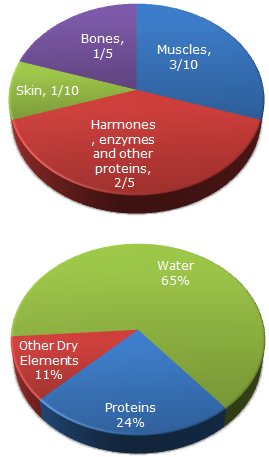
The following pie chart give the information about the distribution of weight in the human body according to different kinds of components. Study the pie charts and answer the question.
Distribution of Weight in Human Body
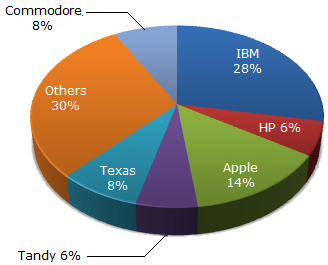
The pie chart shows the distribution of New York market share by value of different computer companies in 2005.
The pie chart shows the distribution of New York market share by volume of different computer companies in 2005.
Number of units sold in 2005 in New York = 1,500
Value of units sold in 2005 in New York = US $1,650,000.
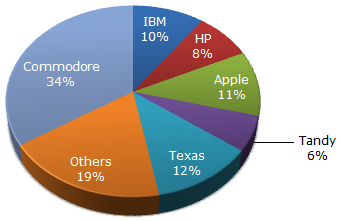
If we assume the total sales to be 100 in the first year, IBM's sales would go up by 50% (from 28 to 42) contributing an increase of 14 to the total sales value.
Similarly, Apple's increase of 15% would contribute an increase of 2.1 to the total sales value. The net change would be 14 + 2.1 on 100. (i.e., 16.1%)
The circle-graph given here shows the spendings of a country on various sports during a particular year. Study the graph carefully and answer the questions given below it.
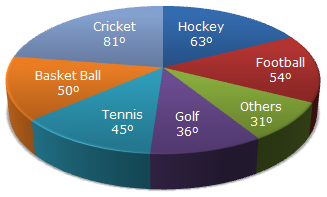
Amount spent on Basketball exceeds that on Tennis by:
| Rs. |  |
(50 - 45) | x 1,80,00,000 |  |
= Rs. 2,50,000. |
| 360 |
| Amount spent on Cricket and Hockey together |
|
|||||||
| = Rs. 0.8 crores | ||||||||
| = Rs. 80,00,000. |
Study the following graph carefully and answer the questions given below:
Distribution of candidates who were enrolled for MBA entrance exam and the candidates (out of those enrolled) who passed the exam in different institutes:
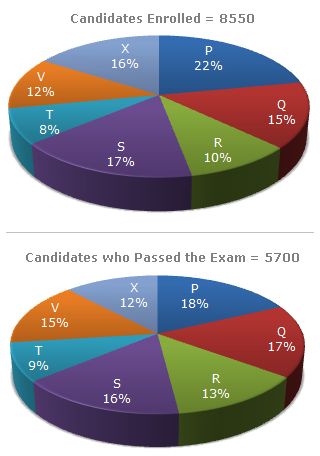
| Required percentage = |  |
9% of 5700 | x 100 |  |
% = | |
9 x 5700 | x 100 | |
% = 75%. |
| 8% of 8550 | 8% of 8550 |
Study the following pie-diagrams carefully and answer the questions given below it:
Percentage Composition of Human Body
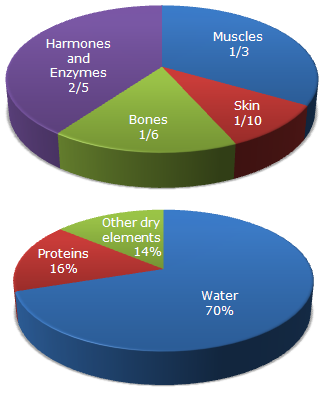
Let the body weight be x kg.
| Then, weight of skin protein in the body |
|
||||||||||
|
 Required percentage = Required percentage = |
 |
|
x 100 | ![]](/_files/images/data-interpretation/common/15-sym-cbracket-h3.gif) |
% = 1.6%. | ||||
| x |
Study the following graph and the table and answer the questions given below.
Data of different states regarding population of states in the year 1998
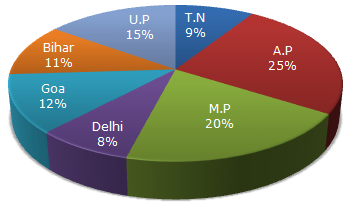
Total population of the given States = 3276000.
| States | Sex and Literacy wise Population Ratio | |||
| Sex | Literacy | |||
| M | F | Literate | Illiterate | |
| A.P | 5 | 3 | 2 | 7 |
| M.P | 3 | 1 | 1 | 4 |
| Delhi | 2 | 3 | 2 | 1 |
| Goa | 3 | 5 | 3 | 2 |
| Bihar | 3 | 4 | 4 | 1 |
| U.P. | 3 | 2 | 7 | 2 |
| T.N. | 3 | 4 | 9 | 4 |
| Number of males in U.P. |
|
|||||||
|
||||||||
| = 294840. |
The following line graph gives the ratio of the amounts of imports by a company to the amount of exports from that company over the period from 1995 to 2001.
Ratio of Value of Imports to Exports by a Company Over the Years.
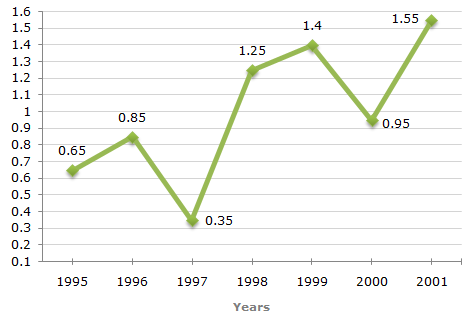
Ratio of imports to exports in the year 1996 = 0.85.
Let the exports in 1996 = Rs. x crores.
| Then, | 272 | = 0.85  x = x = |
272 | = 320. |
| x | 0.85 |
Exports in 1996 = Rs. 320 crores.
Study the following line graph which gives the number of students who joined and left the school in the beginning of year for six years, from 1996 to 2001.
Initial Strength of school in 1995 = 3000.
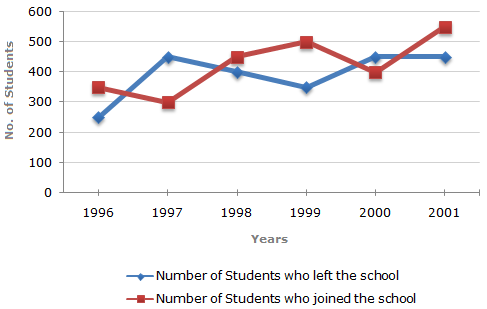
| Required ratio = | 300 | = | 2 | . |
| 450 | 3 |
Study the following table and answer the questions based on it.
Expenditures of a Company (in Lakh Rupees) per Annum Over the given Years.
| Year | Item of Expenditure | ||||
| Salary | Fuel and Transport | Bonus | Interest on Loans | Taxes | |
| 1998 | 288 | 98 | 3.00 | 23.4 | 83 |
| 1999 | 342 | 112 | 2.52 | 32.5 | 108 |
| 2000 | 324 | 101 | 3.84 | 41.6 | 74 |
| 2001 | 336 | 133 | 3.68 | 36.4 | 88 |
| 2002 | 420 | 142 | 3.96 | 49.4 | 98 |
| Required percentage |
|
|||||||
|
||||||||
 1%. 1%. |
A school has four sections A, B, C, D of Class IX students.
The results of half yearly and annual examinations are shown in the table given below.
| Result | No. of Students | |||
| Section A | Section B | Section C | Section D | |
| Students failed in both Exams | 28 | 23 | 17 | 27 |
| Students failed in half-yearly but passed in Annual Exams | 14 | 12 | 8 | 13 |
| Students passed in half-yearly but failed in Annual Exams | 6 | 17 | 9 | 15 |
| Students passed in both Exams | 64 | 55 | 46 | 76 |
Pass percentages in at least one of the two examinations for different sections are:
| For Section A | |
(14 + 6 + 64) | x 100 | |
% = | |
84 | x 100 | |
% = 75%. |
| (28 + 14 + 6 + 64) | 112 |
| For Section B | |
(12 + 17 + 55) | x 100 | |
% = | |
84 | x 100 | |
% = 78.5%. |
| (23 + 12 + 17 + 55) | 107 |
| For Section C | |
(8 + 9 + 46) | x 100 | |
% = | |
63 | x 100 | |
% = 78.75%. |
| (17 + 8 + 9 + 46) | 80 |
| For Section D | |
(13 + 15 + 76) | x 100 | |
% = | |
104 | x 100 | |
% = 79.39%. |
| (27 + 13 + 15 + 76) | 131 |
Clearly, the pass percentage is maximum for Section D.
The following table shows the number of new employees added to different categories of employees in a company and also the number of employees from these categories who left the company every year since the foundation of the Company in 1995.
| Year | ||||||||||
| Managers | Technicians | Operators | Accountants | Peons | ||||||
| New | Left | New | Left | New | Left | New | Left | New | Left | |
| 1995 | 760 | - | 1200 | - | 880 | - | 1160 | - | 820 | - |
| 1996 | 280 | 120 | 272 | 120 | 256 | 104 | 200 | 100 | 184 | 96 |
| 1997 | 179 | 92 | 240 | 128 | 240 | 120 | 224 | 104 | 152 | 88 |
| 1998 | 148 | 88 | 236 | 96 | 208 | 100 | 248 | 96 | 196 | 80 |
| 1999 | 160 | 72 | 256 | 100 | 192 | 112 | 272 | 88 | 224 | 120 |
| 2000 | 193 | 96 | 288 | 112 | 248 | 144 | 260 | 92 | 200 | 104 |
Total number of employees of various categories working in the Company in 1997 are:
| Managers | = (760 + 280 + 179) - (120 + 92) = 1007. |
| Technicians | = (1200 + 272 + 240) - (120 + 128) = 1464. |
| Operators | = (880 + 256 + 240) - (104 + 120) = 1152. |
| Accountants | = (1160 + 200 + 224) - (100 + 104) = 1380. |
| Peons | = (820 + 184 + 152) - (96 + 88) = 972. |
Pooled average of all the five categories of employees working in the Company in 1997
| = | 1 | x (1007 + 1464 + 1152 + 1380 + 972) |
| 5 |
| = | 1 | x (5975) |
| 5 |
= 1195.
Required difference
= (272 + 240 + 236 + 256 + 288) - (200 + 224 + 248 + 272 + 260)
= 88.
Total number of Operators who left the Company during 1995 - 2000
= (104 + 120 + 100 + 112 + 144)
= 580.
Total number of Operators who joined the Company during 1995 - 2000
= (880 + 256 + 240 + 208 + 192 + 248)
= 2024.
| Required Percentage = |
|
580 | x 100 | |
% = 28.66% 29%. |
| 2024 |
The bar graph given below shows the sales of books (in thousand number) from six branches of a publishing company during two consecutive years 2000 and 2001.
Sales of Books (in thousand numbers) from Six Branches - B1, B2, B3, B4, B5 and B6 of a publishing Company in 2000 and 2001.

| Required percentage |
|
|||||||
|
||||||||
| = 73.17%. |
A soft drink company prepares drinks of three different flavours - X, Y and Z. The production of three flavours over a period of six years has been expressed in the bar graph provided below.
Production of Three Different Flavours X, Y and Z by a Company over the years (in lakh bottles)
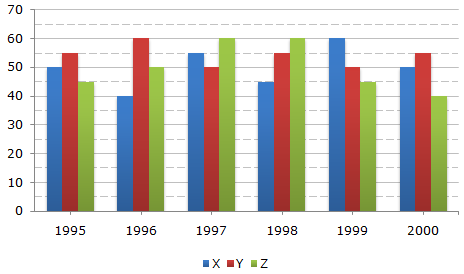
The percentage rise/fall in production from the previous year for flavour Y during various years are:
| In 1996 = | |
(60 - 55) | x 100 | |
% = 9.09% (increase) |
| 55 |
| In 1997 = | |
(60 - 50) | x 100 | |
% = 16.67% (decrease) |
| 60 |
| In 1998 = | |
(55 - 50) | x 100 | |
% = 10% (increase) |
| 55 |
| In 1999 = | |
(55 - 50) | x 100 | |
% = 9.09% (decrease) |
| 55 |
| In 2000 = | |
(55 - 50) | x 100 | |
% = 10% (increase) |
| 50 |
Maximum change is decrease of 16.67% during 1997.
The bar graph given below shows the percentage distribution of the total production of a car manufacturing company into various models over two years.
Percentage of Six different types of Cars manufactured by a Company over Two Years
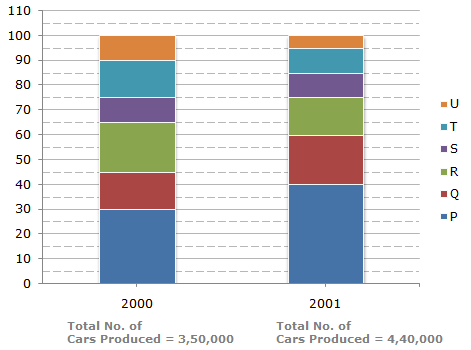
Number of S type cars which remained unsold in 2000 = 15% of 35,000
and number of S type cars which remained unsold in 2001 = 15% of 44,000.
Total number of S type cars which remained unsold
= 15% of (35,000 + 44,000)
= 15% of 79,000
= 11,850.